User guide
Design manual
The manual of all the NetBID functions is linked here NetBID_manual.pdf. Every function has its own demo scripts to demonstrate its functionality.
By design, functions in NetBID2 R packages can be grouped into the following function modules: 1) the three main steps: network reconstruction, driver inference (master table generation), and result visualization; and 2) the supporting modules: eSet manipulation, ID conversion, cluster visualization, Gene set analysis, color code and pipeline.
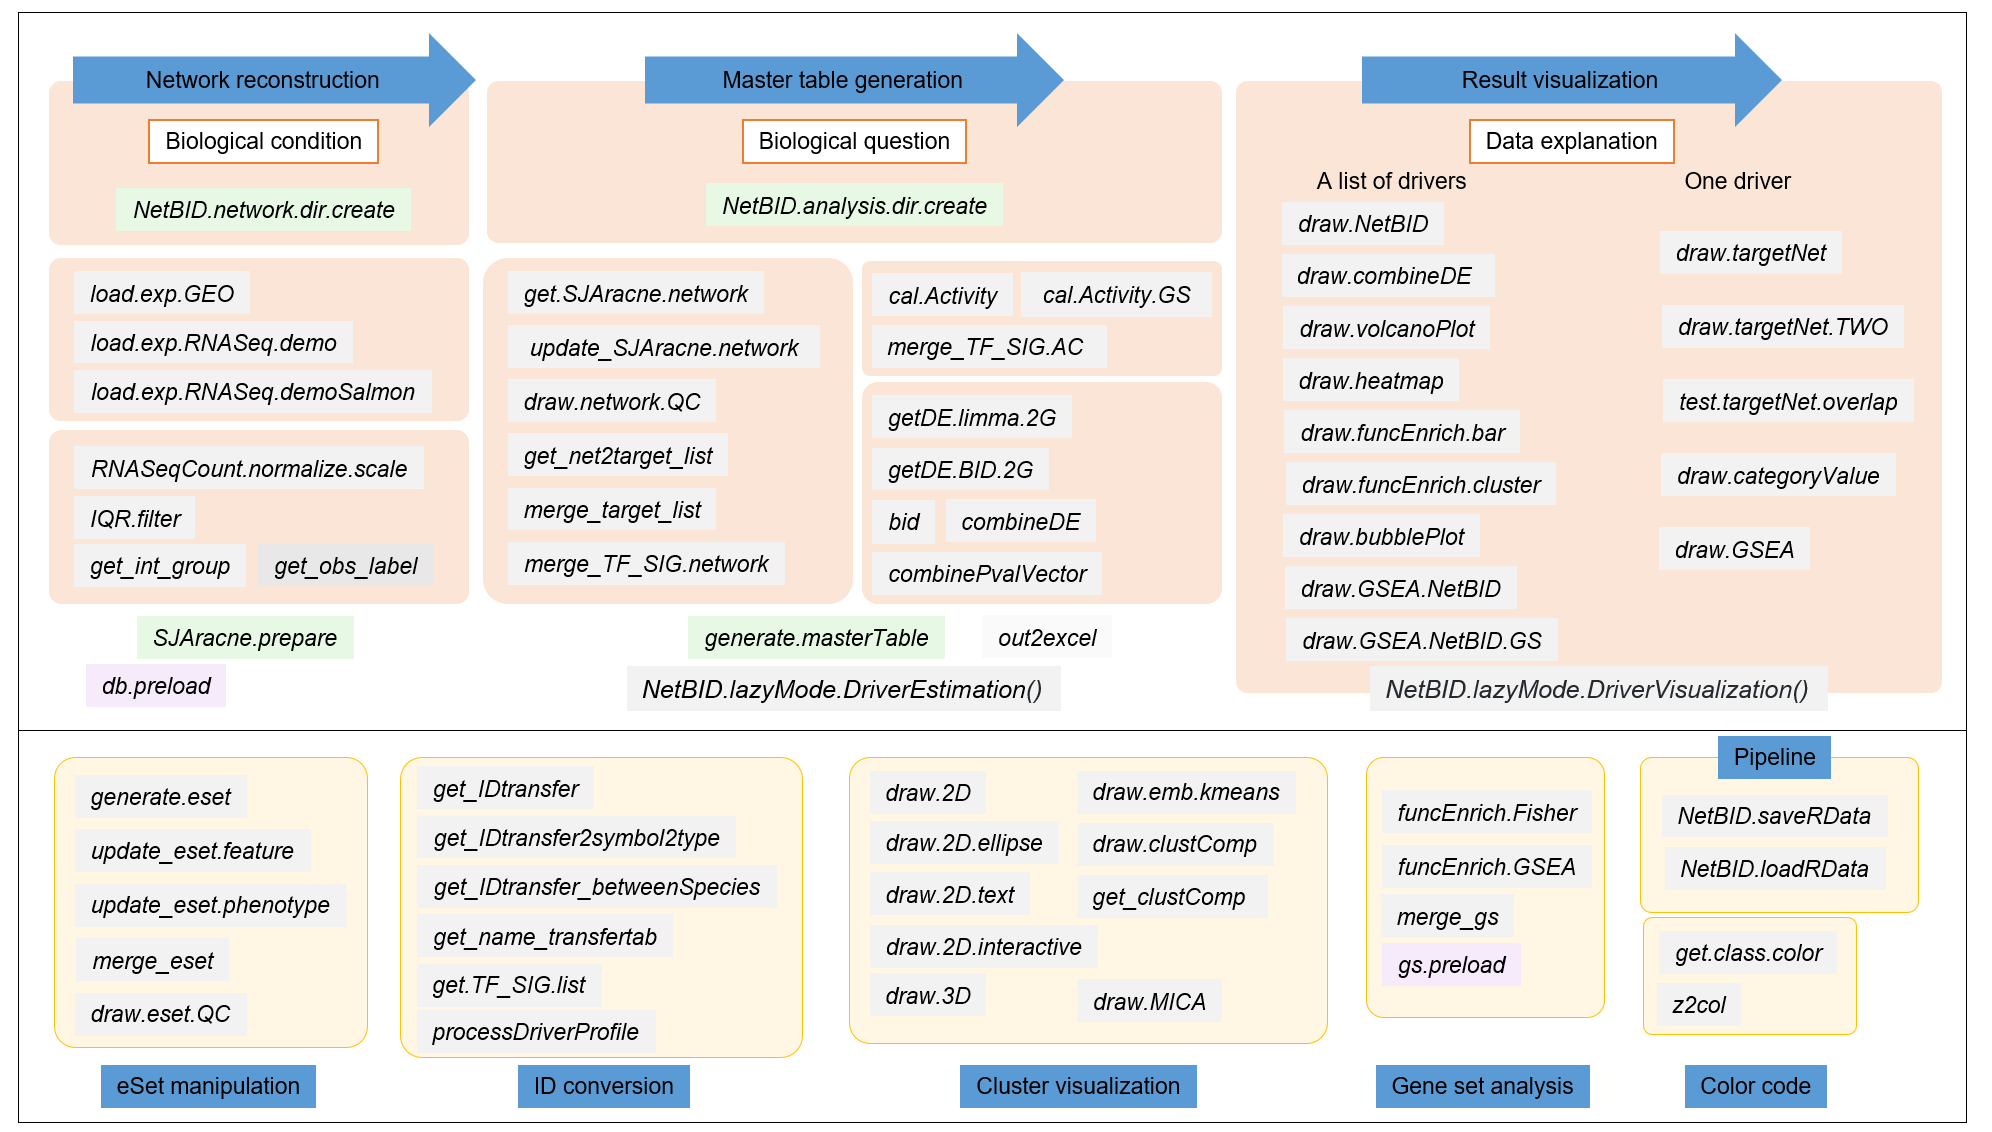
As several calculation steps and numerous datasets are included in the driver analysis, NetBID2 provides several functions to assist with pipeline and data management.
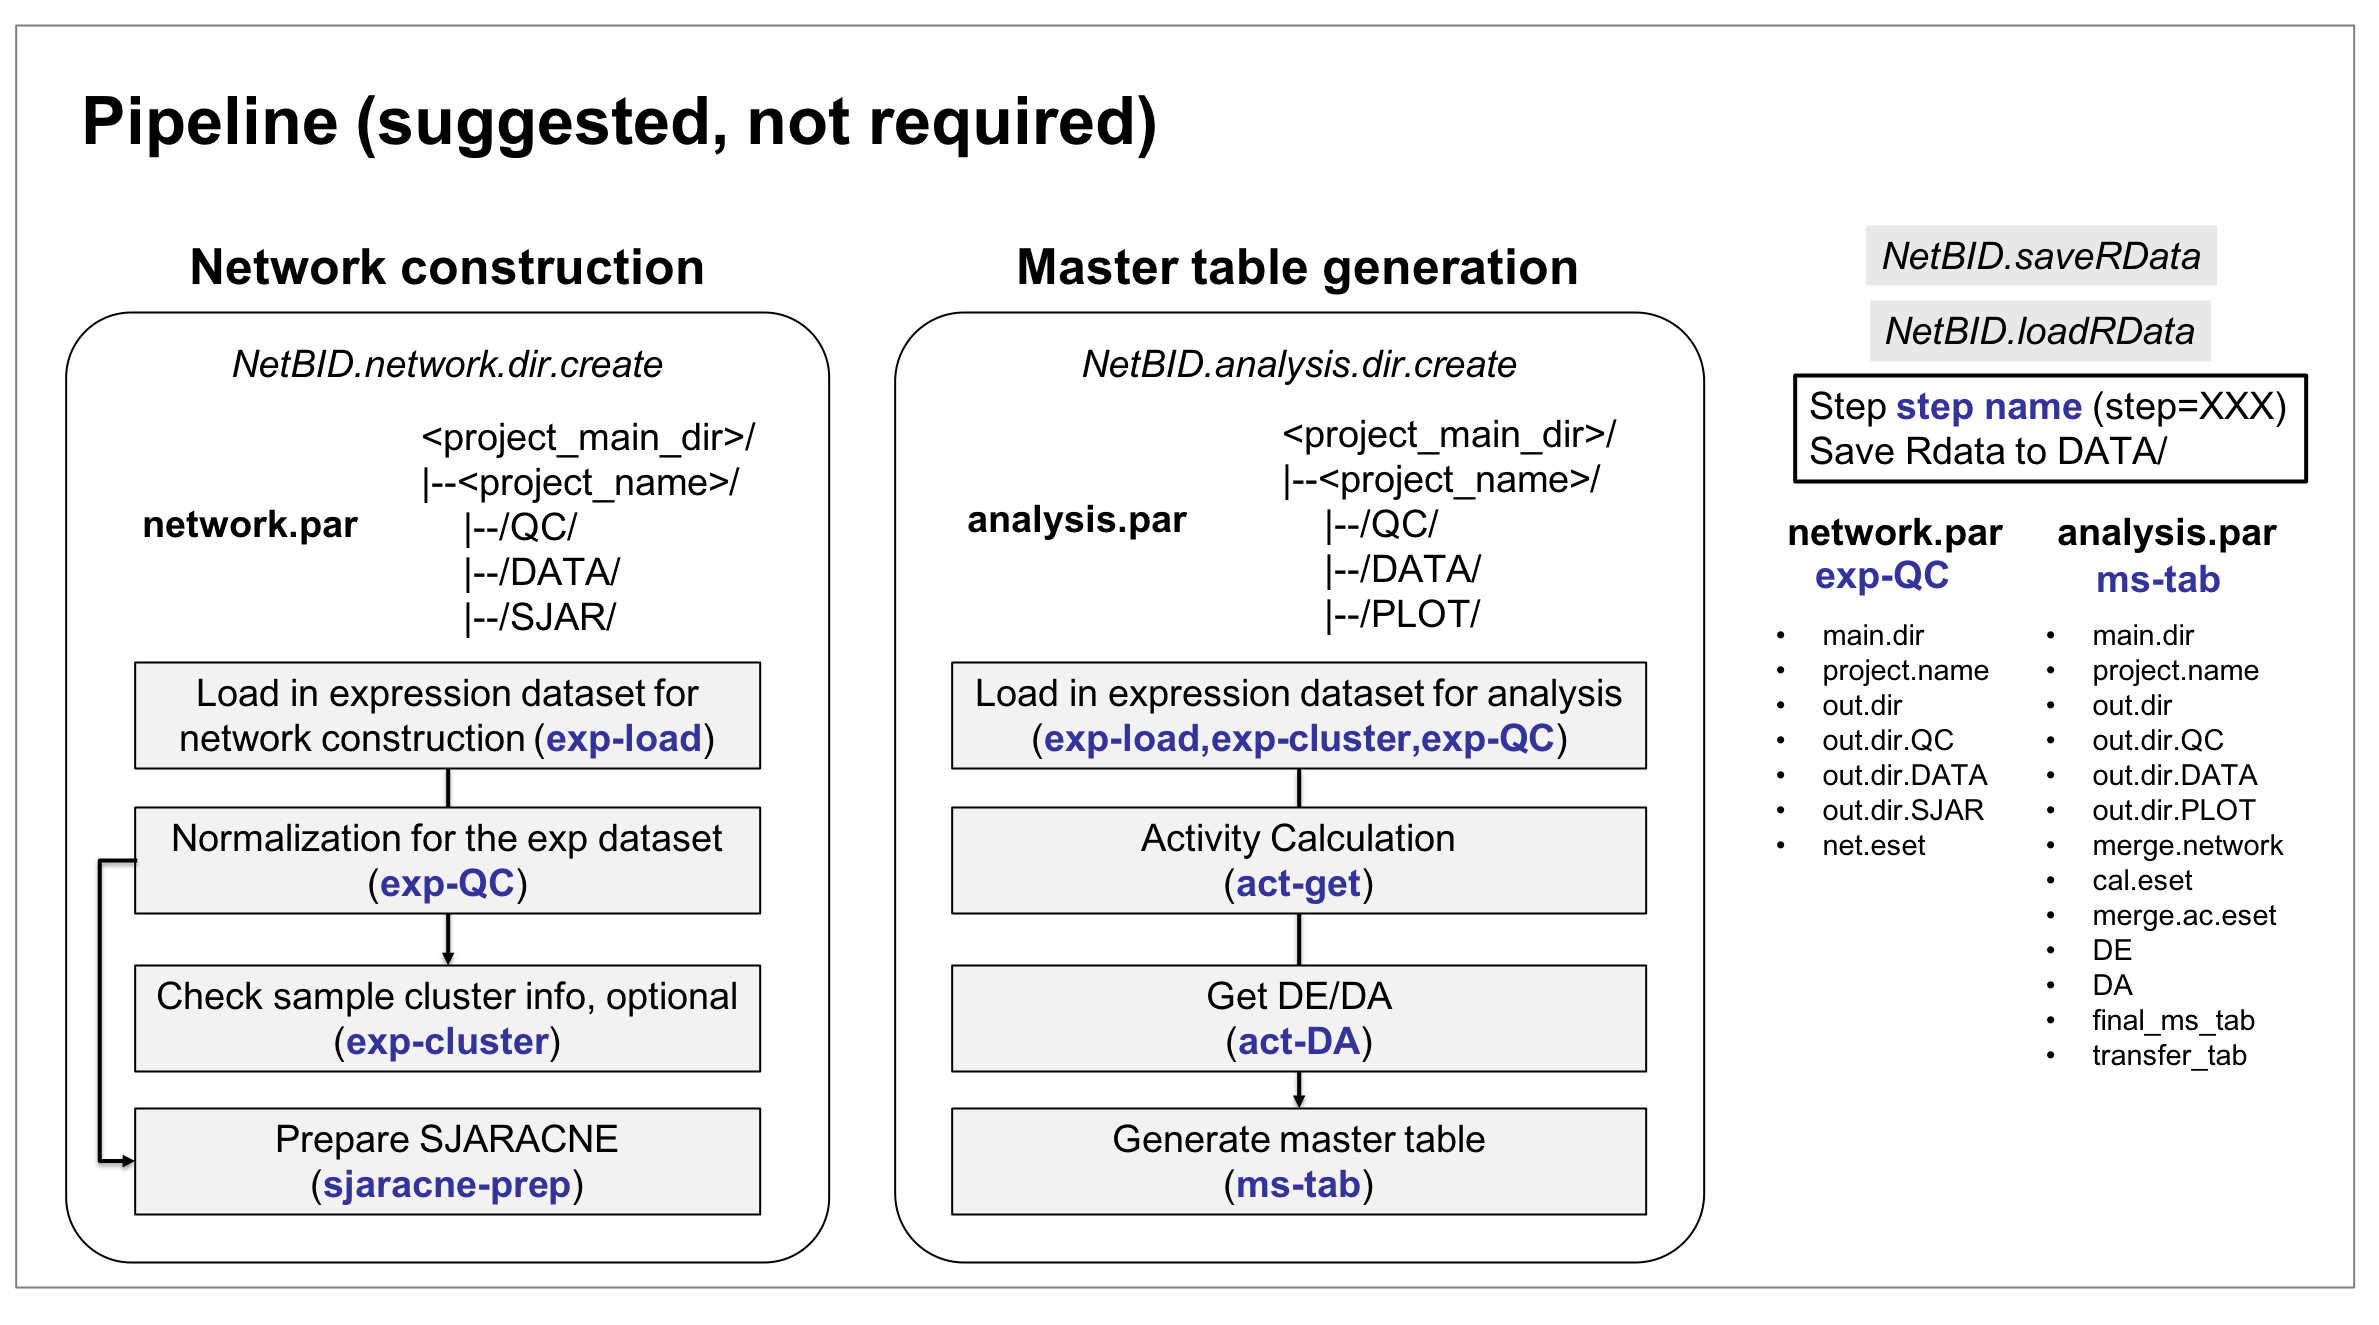
Four functions that are ESSENTIAL for NetBID2 pipeline management:
-
NetBID.network.dir.create()helps the user to create an organized working directory for the network reconstruction step in NetBID analysis. It creates a hierarchical working directory and returns a list containing information about this directory. -
NetBID.analysis.dir.create()helps the user to create an organized working directory for the driver inference (master table generation) step in NetBID analysis. Similarly, it also creates a hierarchical working directory and returns a list containing information about this directory. -
NetBID.saveRData()helps the user to save the main list object (e.g network.par, analysis.par, as described below) containing complicated datasets in a single RData format file, named according to the step code. This function help the users to control the step calculation and avoid possible omissions. -
NetBID.loadRData()pairs withNetBID.saveRData(), reloading previous saved Rdata.
Two list objects that are ESSENTIAL for NetBID2 pipeline analysis:
network.paris a variable in the network reconstruction step. It is created byNetBID.network.dir.create()with network reconstruction directory information wrapped inside. This list object is used to store all of the important results from the network reconstruction pipeline. It can be saved as RData and reloaded back by usingNetBID.saveRData()andNetBID.loadRData().analysis.paris a variable in the driver inference step (master table generation). It is created byNetBID.analysis.dir.create()with driver inference directory information wrapped inside. This list object is used to store all the important results from the driver inference pipeline. It also can be saved as RData and reloaded back usingNetBID.saveRData()andNetBID.loadRData().
The NetBID2 pipeline is summarized in figure below,
We strongly recomment that new users follow the pipeline for driver analysis and visualization. In the following tutorial, details of the NetBID2 pipeline are shown and explained using a demo dataset. Of course, most functions in NetBID2 are still sufficiently flexible to meet the specific requirements of the user.
Demo dataset
We chose a demo dataset from the GEO database: GSE116028.
This microarray dataset contains data from 13 adult medulloblastoma (MB) samples. Three phenotype subgroups of adult MB have been identified based on their expression profiles, clinical features, pathological features, and prognosis. These subgroups, together with their sample numbers, are SHH (3 samples), WNT (4 samples), and Group 4 (6 samples). Group 4 tumors in adults have significantly worse progression-free and overall survival when compared to the other molecular subtypes of MB.
Here, the goal is to find potential drivers in Group4, as compared to other subtypes, by using NetBID analysis. This may relate to specific clinical features of the Group4 MB subtype.
Although a microarray dataset is used in the tutorial, NetBID2 is also capable of analyzing RNA-seq data, as we will show.
The tutorial contains three main parts, they can be followed by order or used independently: