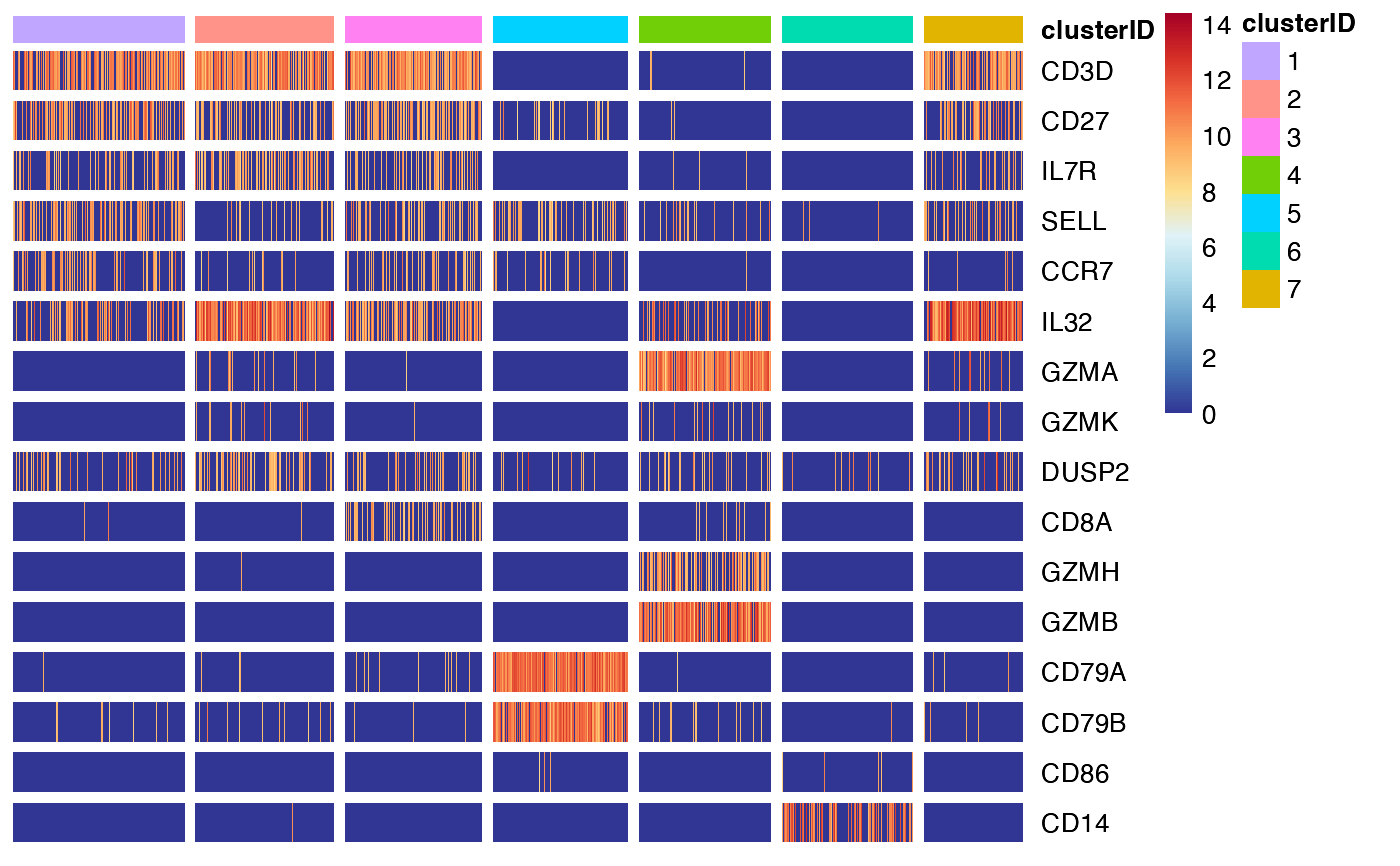
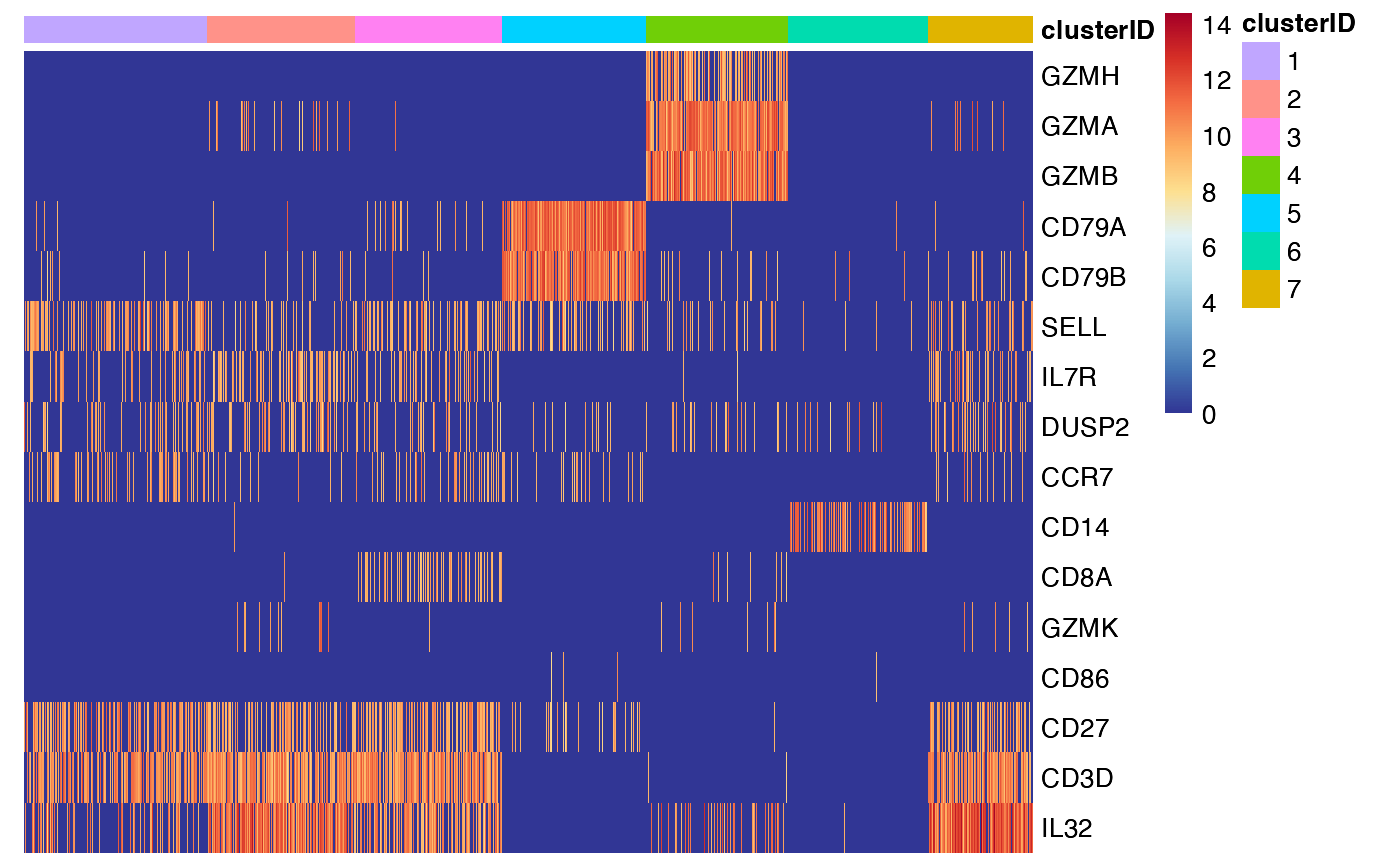
Heatmap showing the expression or activity of selected features by self-defined groups
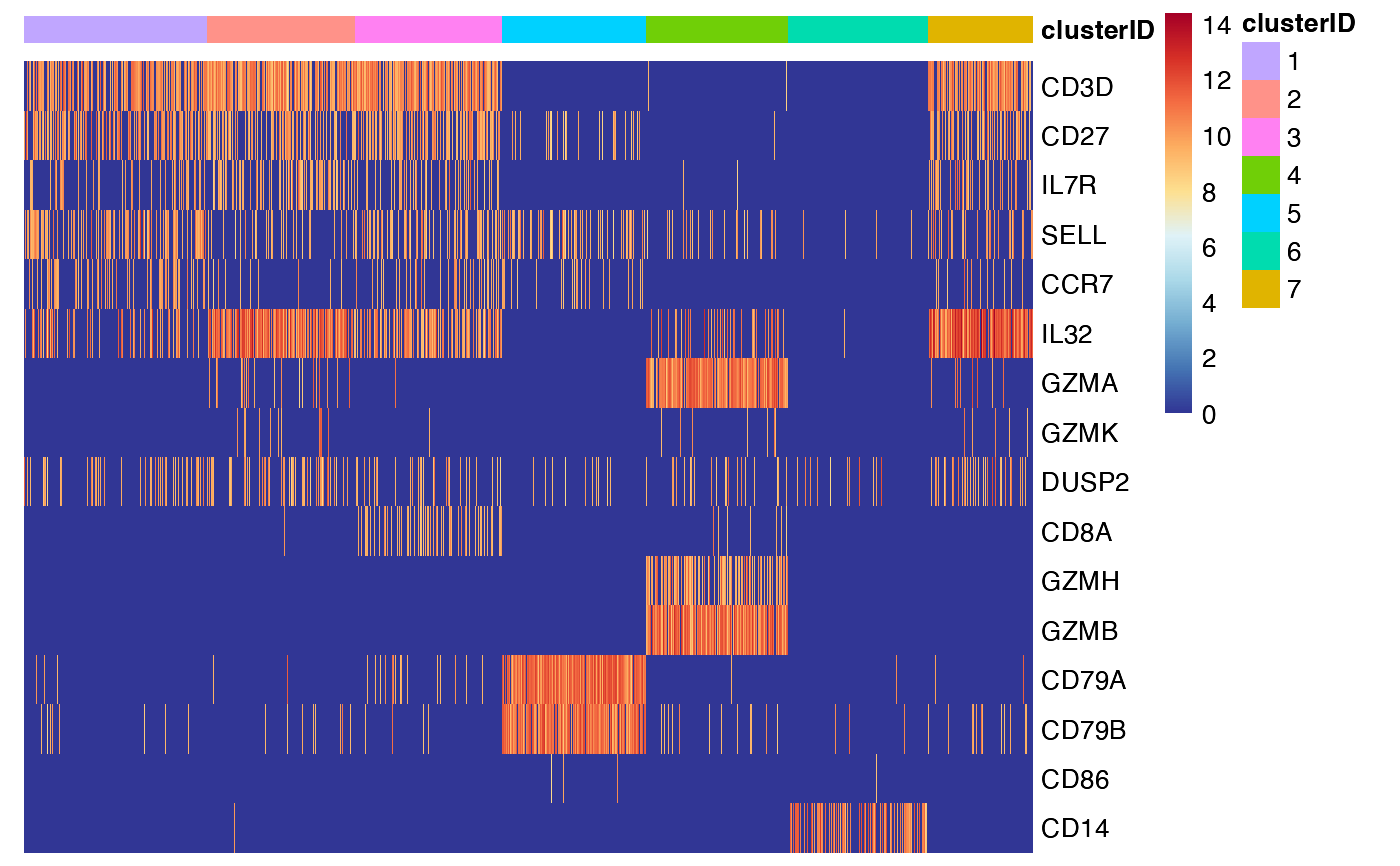
feature_heatmap.RdThis function is used to draw a heatmap of selected features among self-defined groups from a sparse eset object. By default, the groups are sorted by size, from largest to smallest. Within each group, the cells are sorted alphabetically.
Usage
feature_heatmap(
  input_eset,
  features = NULL,
  group_by = "clusterID",
  scale_method = "none",
  annotation_columns = NULL,
  use_gaps.column = FALSE,
  cluster_rows = FALSE,
  show_rownames = TRUE,
  fontsize.row = 10,
  use_gaps.row = FALSE
)
Arguments
- input_eset
The expression set object that filtered, normalized and log-transformed
- features
A vector of genes or drivers (row.names of the input eset) to plot
- group_by
Character, name of the column for grouping, usually the column of cell types or clusters. Default: "
clusterID".- scale_method
Character, method for data scaling: "
none" (the default), "column", "row".- annotation_columns
Character, name(s) of the column(s) to add for cell annotation. Default:
NULL.- use_gaps.column
Logical, whether to put a gap between cell groups. Default:
FALSE.- cluster_rows
Logical, whether to cluster the rows. If
TRUE, the rows will be clustered. IfFALSE, the rows are displays following the order in 'features'. Default:FALSE.- show_rownames
Logical, whether to show the rownames. Default:
TRUE.- fontsize.row
Numeric, font size of the rownames. Defualt: 10.
- use_gaps.row
Logical, whether to put a gap between features. Default:
FALSE.
Examples
data(pbmc14k_expression.eset)
features_of_interest <- c("CD3D","CD27","IL7R","SELL","CCR7","IL32","GZMA","GZMK",
"DUSP2","CD8A","GZMH","GZMB","CD79A","CD79B","CD86","CD14")
## 1. the most commonly used command
feature_heatmap(input_eset = pbmc14k_expression.eset,
features = features_of_interest,
group_by = "clusterID")
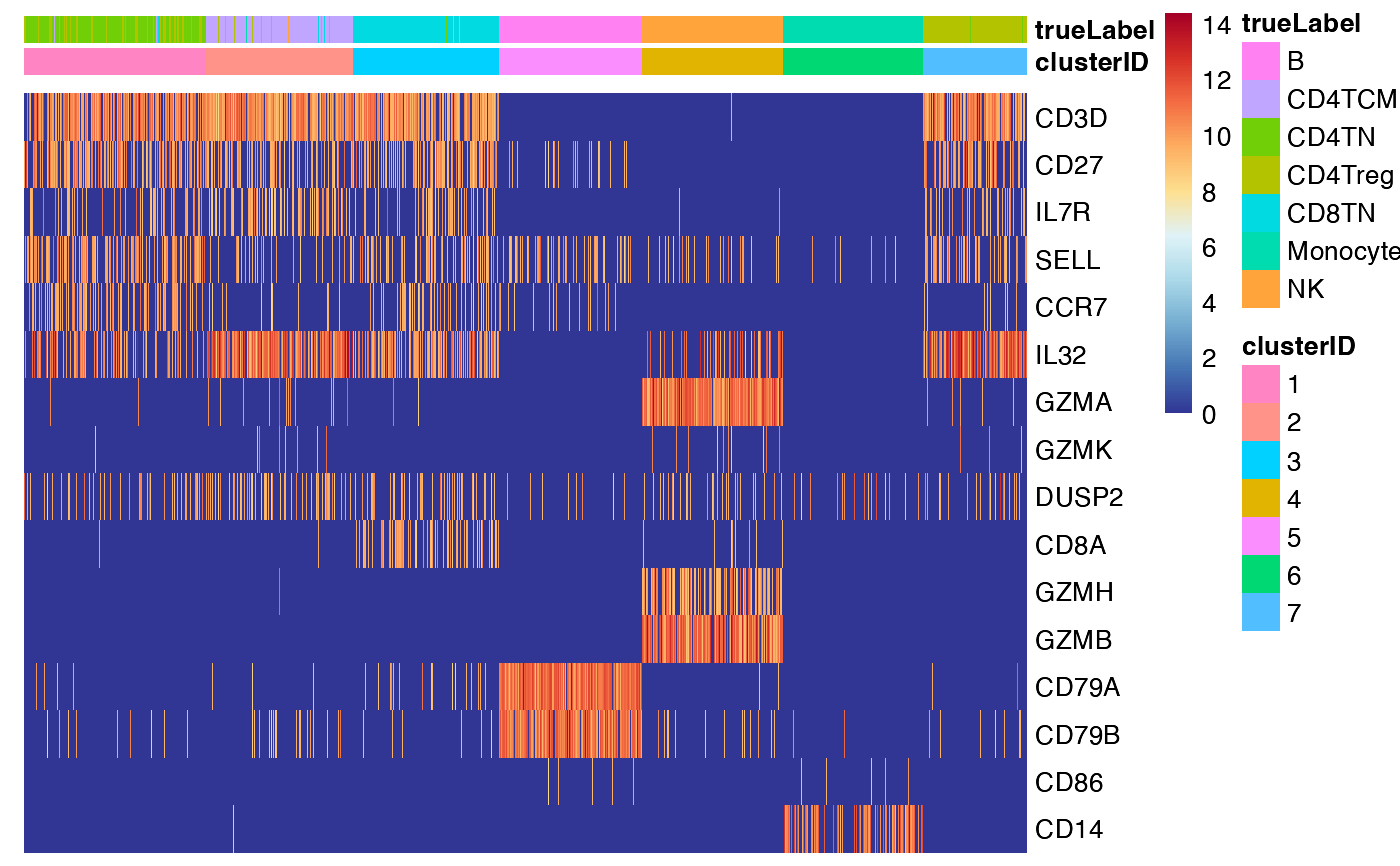
 ## 2. add one more column ('true_label') for cell annotation
feature_heatmap(input_eset = pbmc14k_expression.eset,
features = features_of_interest,
group_by = "clusterID",
annotation_columns = c("trueLabel"))
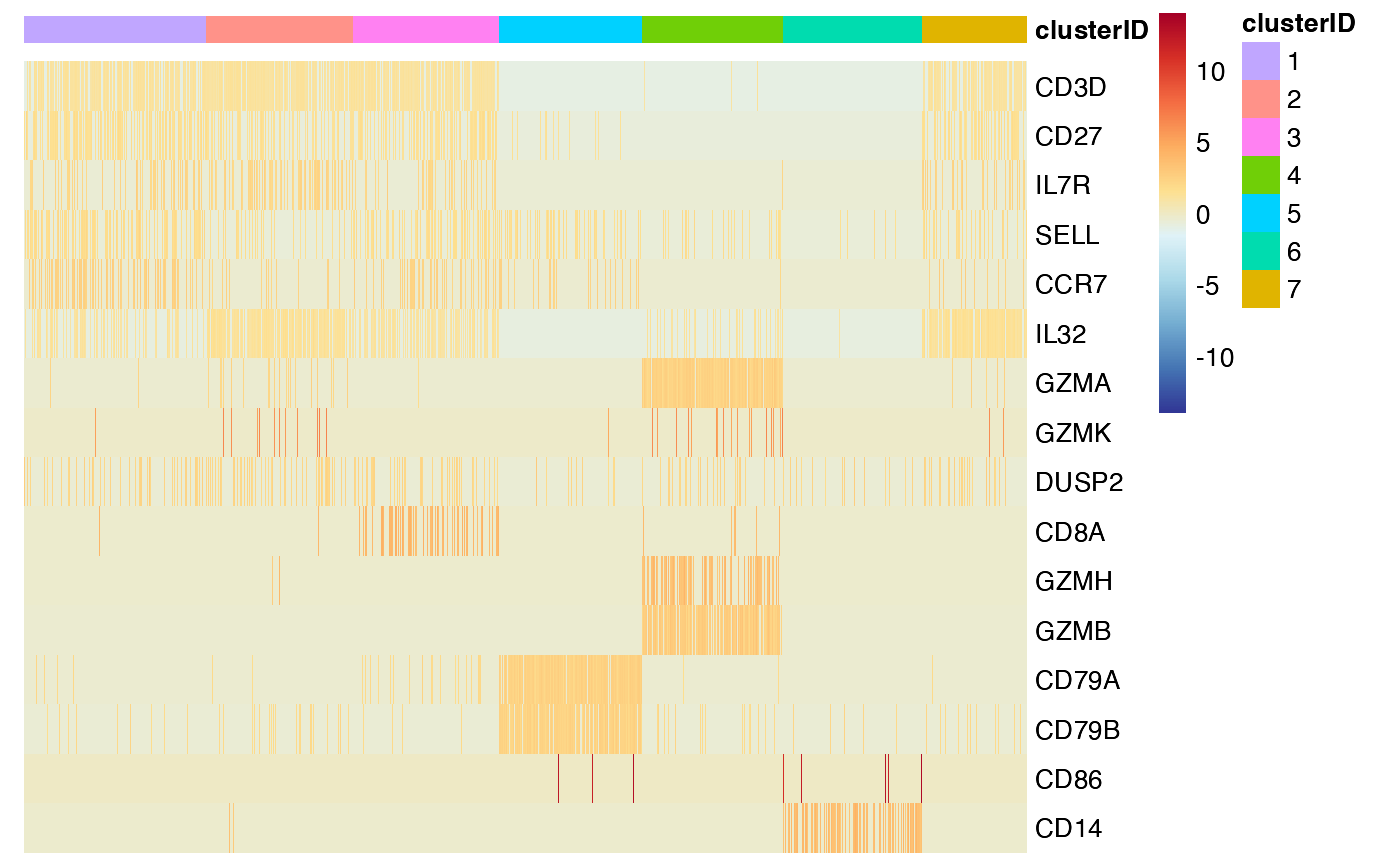
 ## 3. scale the data by row
feature_heatmap(input_eset = pbmc14k_expression.eset,
features = features_of_interest,
group_by = "clusterID",
scale_method = "row")
 ## 4. cluster the rows
feature_heatmap(input_eset = pbmc14k_expression.eset,
features = features_of_interest,
group_by = "clusterID",
cluster_rows = TRUE)
 ## 5. add gaps
feature_heatmap(input_eset = pbmc14k_expression.eset,
features = features_of_interest,
group_by = "clusterID",
use_gaps.column = TRUE,
use_gaps.row = TRUE)
