Bubble blot showing the expression or activity of selected features by self-defined groups
feature_bubbleplot.RdThis function is used to draw a bubble plot of selected features among self-defined groups from a sparse eset object.
Usage
feature_bubbleplot(
  input_eset,
  features = NULL,
  group_by = "clusterID",
  colors = NULL,
  legend.position = "right",
  fontsize.legend_title = 10,
  fontsize.legend_text = 8,
  fontsize.axis_title = 10,
  fontsize.axis_text = 8,
  xlabel.angle = 0
)
Arguments
- input_eset
The expression set object that filtered, normalized and log-transformed
- features
A vector of genes or drivers (row.names of the input eset) to plot
- group_by
Character, name of the column for grouping, usually the column of cell types or clusters. Default: "
clusterID".- colors
A vector of two colors indicating the low and high values respectively. Default: c("
lightgrey", "red").- legend.position
Character, position of legend: "
right" (the default), "left", "top", "bottom" or "none".- fontsize.legend_title
Integer, font size of the legend title. Default: 10.
- fontsize.legend_text
Integer, font size of the legend text. Default: 8.
- fontsize.axis_title
Integer, font size of the axis label and text. Default: 10.
- fontsize.axis_text
Integer, font size of the axis label and text. Default: 8.
- xlabel.angle
Numeric, the angle of the a-axis title. When it's set not 0, the x-axis text will automatically right-justified. Default: 0.
Examples
data(pbmc14k_expression.eset)
features_of_interest <- c("CD3D","CD27","IL7R","SELL","CCR7","IL32","GZMA","GZMK",
"DUSP2","CD8A","GZMH","GZMB","CD79A","CD79B","CD86","CD14")
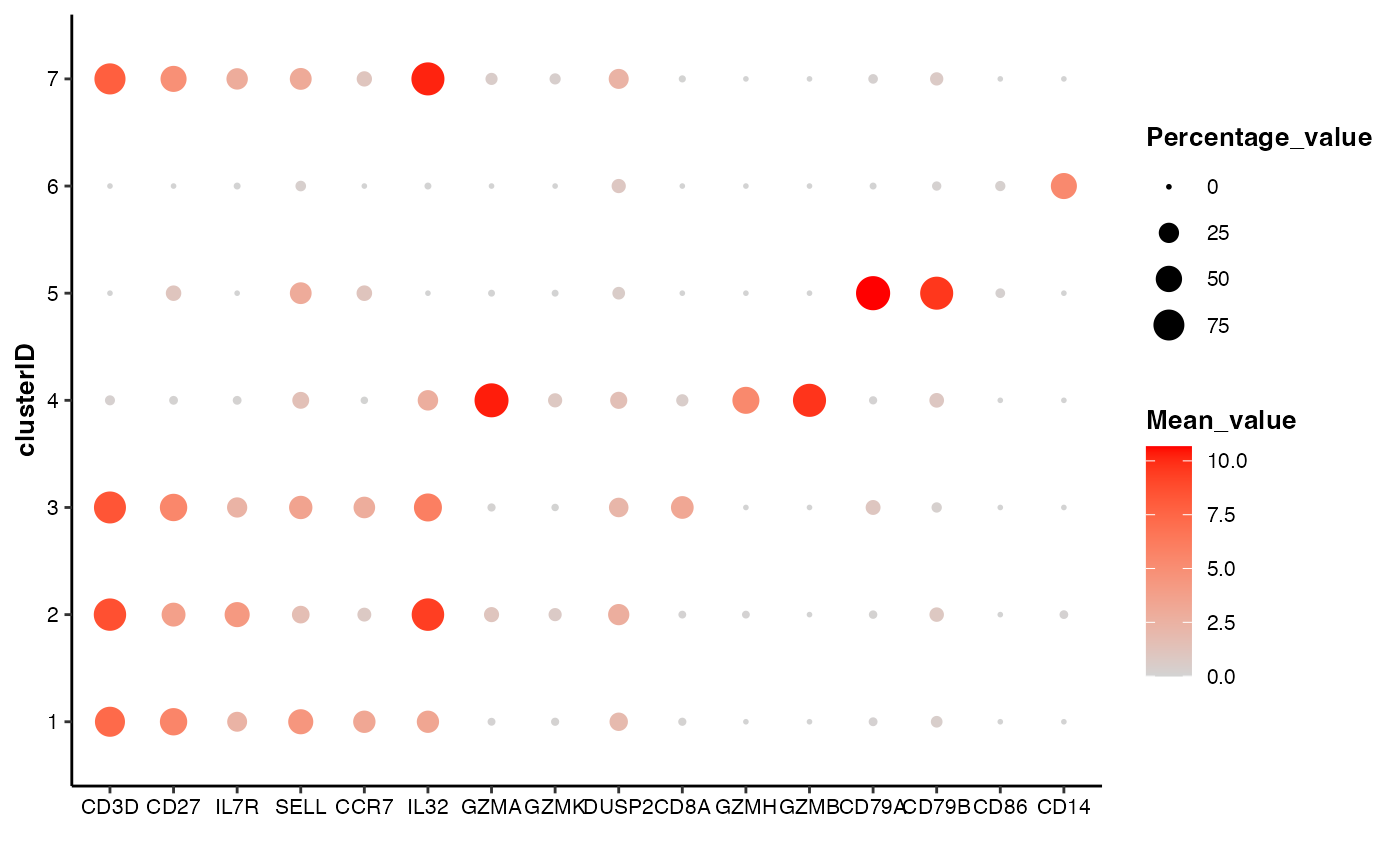
## 1. the most commonly used command
feature_bubbleplot(input_eset = pbmc14k_expression.eset,
features = features_of_interest,
group_by = "clusterID")
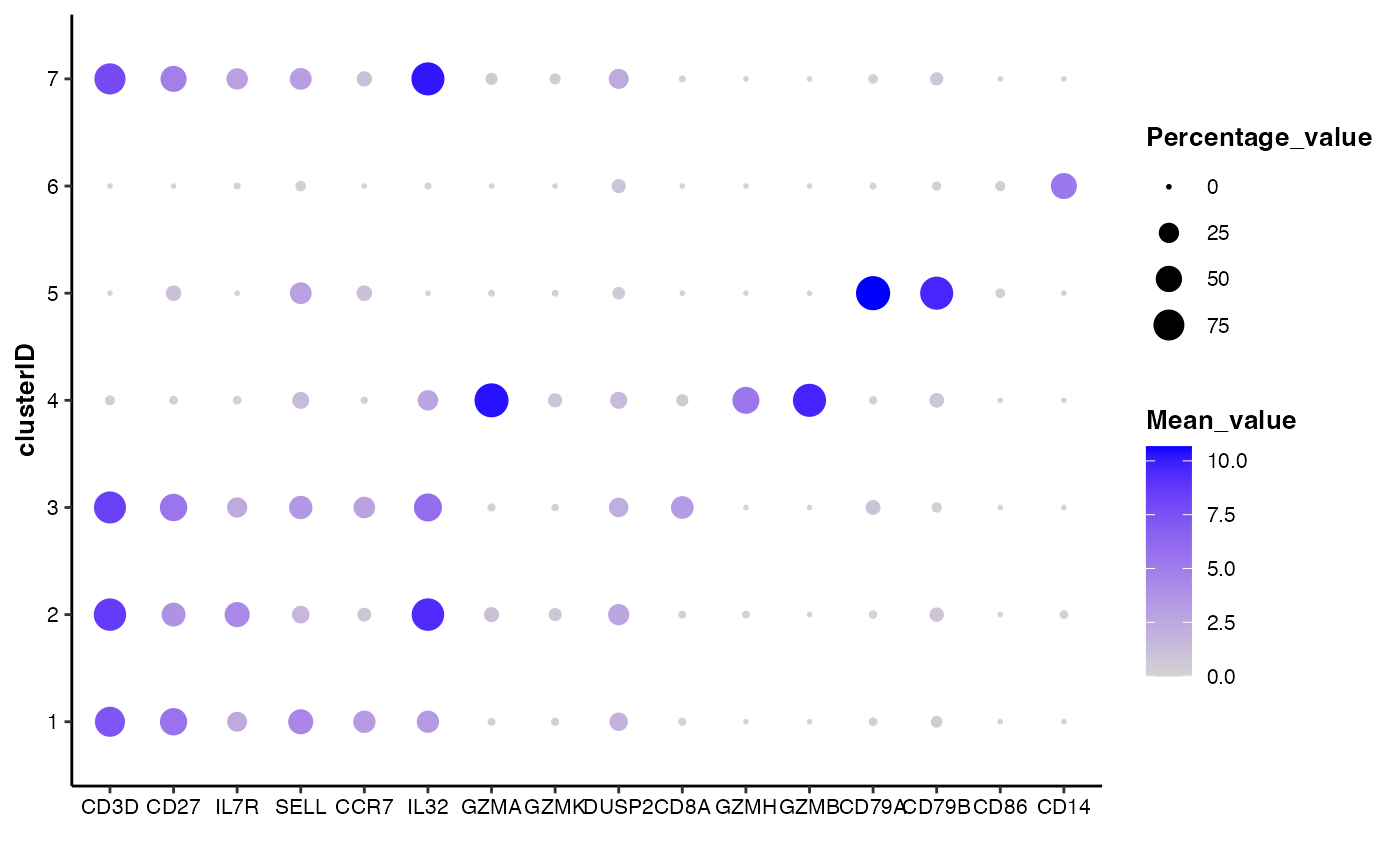
 ## 2. customize the colors
feature_bubbleplot(input_eset = pbmc14k_expression.eset,
features = features_of_interest,
group_by = "clusterID",
colors = c("lightgrey", "blue"))
## 2. customize the colors
feature_bubbleplot(input_eset = pbmc14k_expression.eset,
features = features_of_interest,
group_by = "clusterID",
colors = c("lightgrey", "blue"))