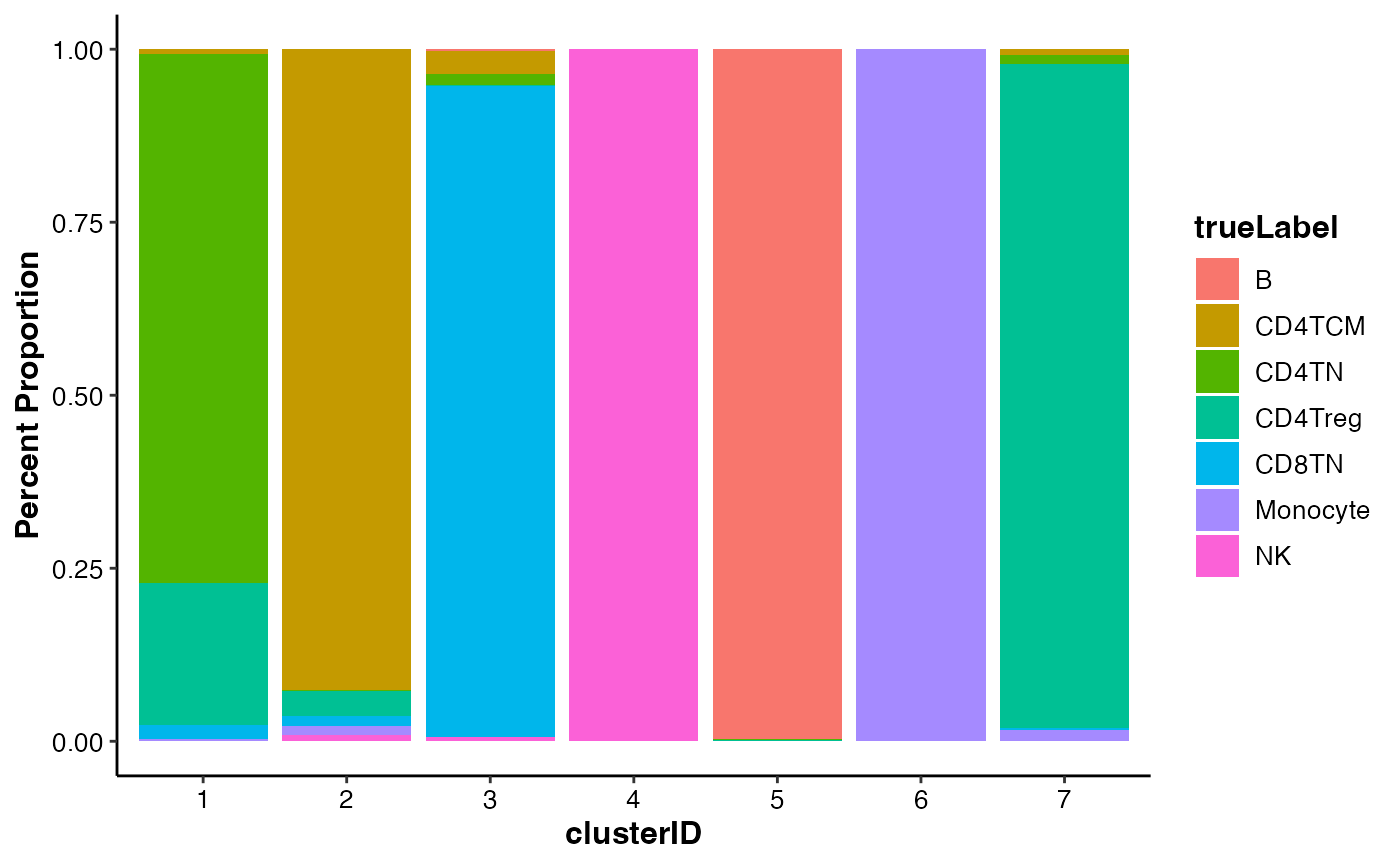
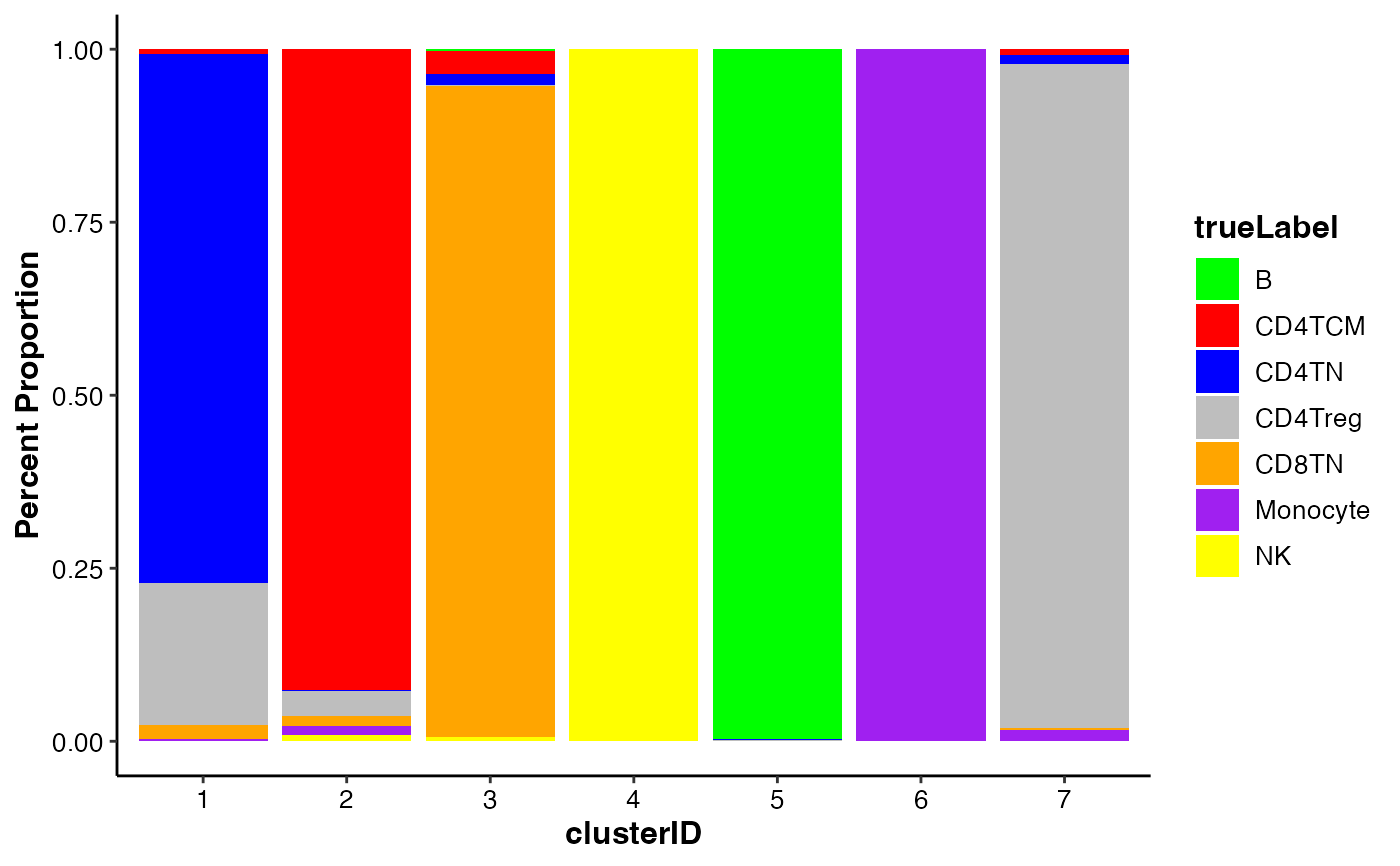
Bar plot showing the cell composition of self-defined groups
draw_barplot.RdThis function is used to draw a bar plot showing the cell composition of self-defined groups.
Usage
draw_barplot(
  input_eset,
  group_by = "clusterID",
  color_by = "cell_type",
  colors = NULL,
  legend.position = "right",
  xlabel.angle = 0,
  fontsize.legend_title = 12,
  fontsize.legend_text = 10,
  fontsize.axis_title = 12,
  fontsize.axis_text = 10
)
Arguments
- input_eset
The expression set object that filtered, normalized and log-transformed
- group_by
Character, name of the column for grouping, usually the column of cell types or clusters. Default: "
clusterID".- color_by
Character, name of the column for color-coding, usually the column of cell types or clusters. Default: "
cell_type".- colors
A vector of colors for filling the violins. The length should be same as the number of groups. Default:
NULL(ggplot default colors).- legend.position
Character, position of legend: "
right" (the default), "left", "top", "bottom" or "none".- xlabel.angle
Numeric, the angle of the a-axis title. When it's set not 0, the x-axis text will automatically right-justified. Default: 0.
- fontsize.legend_title
Integer, font size of the legend title. Default: 10.
- fontsize.legend_text
Integer, font size of the legend text. Default: 8.
- fontsize.axis_title
Integer, font size of the axis label and text. Default: 10.
- fontsize.axis_text
Integer, font size of the axis label and text. Default: 8.
Examples
data(pbmc14k_expression.eset)

## 1. bar plot grouped by clusters ("clusterID") and colored by true labels ("true_label)
draw_barplot(input_eset = pbmc14k_expression.eset,
             group_by = "clusterID",
             color_by = "trueLabel")


## 2. customize the colors
draw_barplot(input_eset = pbmc14k_expression.eset,
             group_by = "clusterID",
             color_by = "trueLabel",
             colors = c("green", "red", "blue", "grey", "orange", "purple", "yellow"))
